Introduction
The carbondate package contains functions for analysing sets of related radiocarbon (14C) determinations. Suppose we have a set of archaeological samples, each of which has a 14C determination . Furthermore, suppose that these samples are known to be related to one another (for example, arising from a particular site, or set of sites, populated by a particular culture). We want to estimate the calendar ages of these samples and investigate changes/variations in the (calendar age) frequency at which the samples arose (as a potential proxy for activity, population size, …):
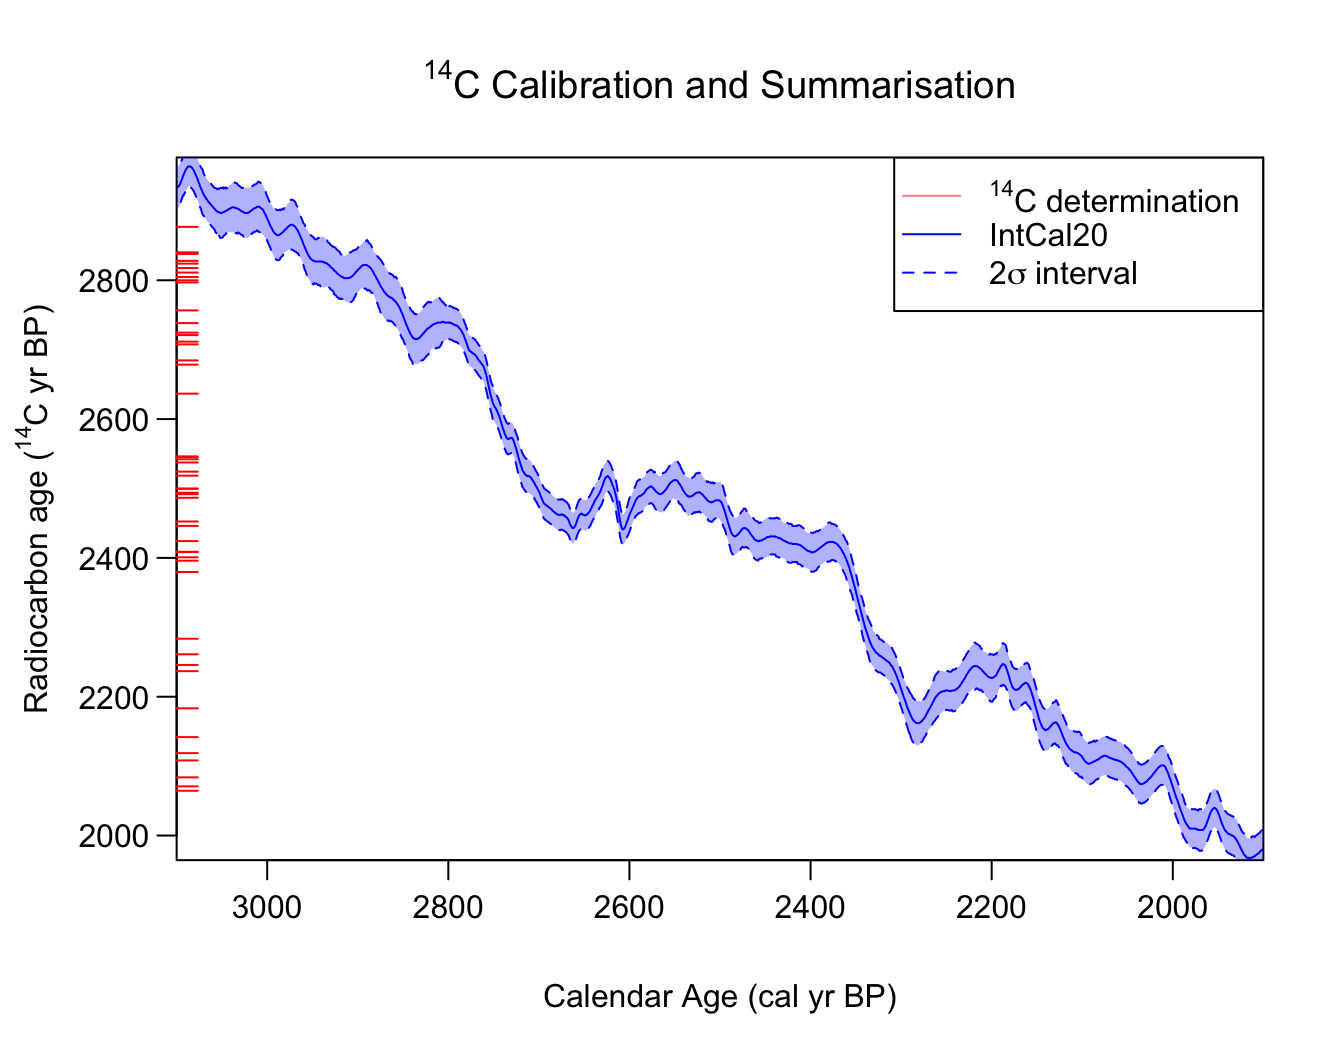
Illustration of our challenge. We observe a set of related samples, each with a 14C determination (shown here as the red ticks on the radiocarbon age axis). Can we jointly calibrate the samples, and summarise the combined calendar age information that they provide?
Each sample has an unknown calendar age (for ). Since they are related, the set of calendar ages for the samples are assumed to arise from the same shared, and unknown, calendar age density . However, we don’t observe the true calendar ages of the samples: only the 14C determinations . Due to fluctuations in past radiocarbon levels, these 14C determinations need to be calibrated (converted) in order to be understood on the calendar age scale and obtain estimates for each . This calibration must be done simultaneously with the summarisation, introducing additional complexity into the overall process.
This library serves two purposes:
- calibration of the set of 14C determinations, i.e., the calendar age estimation of the , can be improved significantly by incorporating the knowledge that the samples are related;
- summarisation of the underlying calendar age distribution from which the samples arise, i.e., estimating , provides a potentially useful proxy for activity, population size, the frequency of past events, … This concept uses the principle of dates-as-data (Rick 1987)
We provide two distinct, albeit ideologically linked, approaches to achieve this:
-
PolyaUrnBivarDirichlet()andWalkerBivarDirichlet()— A non-parametric Bayesian density estimation approach using a Dirichlet process mixture model (DPMM) implemented via two different Markov Chain Monte Carlo (MCMC) algorithms (Heaton 2022). This is a statistically-rigorous alternative to summed probability distributions (SPDs) and kernel density estimates (KDE models). -
PPcalibrate()— A inhomogeneous Poisson process/Changepoint approach using Reversible Jump Markov Chain Monte Carlo (RJ-MCMC) to estimate the changing rate at which the 14C samples occur over calendar time.
Separate vignettes are provided to describe each approach. Which approach is more appropriate to apply will be situation dependent, and will be determined by the nature of the underlying shared calendar age distribution :
- Can the set of potential samples (the population) be well
approximated by a mixture of, potentially overlapping, clusters? In
which case
PolyaUrnBivarDirichlet()orWalkerBivarDirichlet()are likely most suitable. - Or is it more likely that the occurrence of samples is characterised
by distinct calendar times when the rate at which those samples arise
changes? In which case
PPcalibrate()will be more appropriate.
Dates-as-Data – Frequency of samples as a proxy for activity
A commonly-used approach to estimate changes in the frequency of past events or the size of populations looks at variations in the rate of archaeological and environmental samples (e.g., charcoal from fires, human/animal bones, or other evidence of occupation) found at a site over time. Time periods with large numbers of samples suggest increased activity, while those with few samples indicate a reduced level of activity. This paradigm is known as dates-as-data (Rick 1987).
The reliability of such a dates-as-data approach is highly dependent upon our ability to estimate the calendar ages of the discoveries. Most archaeological/environmental dates are obtained using radiocarbon. The need for calibration of these 14C samples introduces considerable uncertainties in the resultant calendar ages and complicates the use of dates-as-data, making it more challenging to identify variations in the calendar year density/rates at which samples occur.
In this library, we provide two theoretically-underpinned approaches to overcome these challenges, each of which has its own set of vignettes:
- A statistically-rigorous alternative to summed probability
distributions (SPDs) that models the samples as arising from a mixture
distribution containing an unknown number of distinct clusters (Heaton 2022). Non-parametric summed density
estimation vignette ;
- A changepoint-based approach that models the occurrence of the 14C samples as an inhomogeneous Poisson process. We aim to reconstruct how the rate at which the samples occur varies over calendar time, and to identify if there are statistically significant changepoints (i.e., specific calendar times at which the rate of samples changes abruptly). Poisson process modelling vignette
Strengths and Weaknesses of Dates-as-Data
Used appropriately, dates-as-data approaches allow users to borrow strength from more data and hence to identify longer-term trends and less-obvious effects that are not possible with smaller sets of data. This has the potential to provide greater insight into mechanisms and processes. However, like any scientific tool, they must not be used uncritically, or treated as a black-box.
In particular, the reliability of any dates-as-data inference will depend hugely upon the representativeness, or otherwise, of the underlying sampling. Two particular considerations which must be taken into account are:
- Potential for Taphonomic Loss — that certain kinds of samples are more/less likely to remain in the archaeological record (e.g., due to preservation) or that fewer older samples will remain. One can (probably) deal with this if can provide the likelihood of loss of different objects/periods. This library does not however currently address this.
- Extent of (non)-representativeness of the underlying sampling — the underlying model assumes that each sample is representative of the overall population/activity. Using sets of 14C data that are dominated by large studies that only looked at particular time periods, or particular materials/samples, are unlikely to provide reliable representation of an overall population.
One must always consider what the sample you are wishing to summarise represents.
Data Requirements
The (most-automated) version of the library only requires two vectors:
- The 14C determinations
:
rc_determinations - The accompanying (lab-reported) measurement uncertainties
:
rc_sigmas
Note: These values can either be provided as
14C ages, or as F14C concentrations (setting the
flag F14C_inputs = FALSE or TRUE
accordingly).
All other model parameters will be adaptively chosen based upon these. More experienced users (with external independent information) may however wish to manually set some of the other parameters (see the help files for further information).
Additional Information
The library also provides some joint data (which can be used by either method) as described below
Calibration Curve
A calibration curve is a mapping providing, for an object of true calendar age , the corresponding radiocarbon age . Estimates of such calibration curves are created using reference material for which we have both 14C measurements and independently-known (or estimated) calendar ages. The radiocarbon determination of any individual sample is assumed to be a noisy observation of the calibration curve, i.e.,
Given a undated object for which we obtain a 14C determination one can estimate its calendar age by inverting this mapping. A calibration curve is a required input for all the functions in this package.
The internationally-ratified standard for the radiocarbon calibration curve is known as IntCal, for which regular updates are provided by the IntCal working group:
- IntCal20 (Reimer et al. 2020) is the current version agreed for use by the community for calibrating samples that obtain their 14C from the Northern Hemispheric atmosphere.
- SHCal20 (Hogg et al. 2020) is the current version when calibrating atmospheric samples from the Southern Hemisphere.
These products provides pointwise estimates of the mean and sd of the relevant (NH or SH) calibration curve, which can be integrated out during calibration, i.e.,:
The curve data intcal20 and shcal20 are
provided in this package. However it is possible to load and use another
calibration curve if you wish.
Example Data
There are some example 14C data sets provided in the package, each of which contain a number of radiocarbon determinations and uncertainties from real-life cases:
kerr: 255 radiocarbon determinations collated by Kerr and McCormick (2014) related to the building and use of raths in Ireland.armit: 2021 radiocarbon determinations collated by Armit et al. (2014) from archaeological groups operating in Ireland, to investigate whether a wetter environment around 2700 cal yr BP led to a population collapse.buchanan: 628 radiocarbon determinations collated by Buchanan, Collard, and Edinborough (2008) representing the ages of distinct archaeological sites found across Canada and North America during the time of the palaeoindians.alces,bison,cervus,equus,human,mammuthus: radiocarbon determinations related to a variety of megafauna (and humans) from Yukon and Alaska (Dale Guthrie 2006). Samples are restricted to those between 25,000–6000 14C yrs BP.
Package User Guide
For those new to calibration we provide the introductory vignettes:
To learn more about the functions (and methods) in the library, look at:
- Rigorous Bayesian non-parametric alternative to SPDs
- Variable-Rate Poisson Process estimation and Changepoint Identification
These pages provide more details on the methods, and simple examples of their usage.